App Monitoring using ELK Stack
Monitor Jenkins Application Logs using ELK Stack

Problem Statement
Jenkins is a widely used CI Tool. There may be a large Jenkins instance or several Jenkins instances used in an organization. So, there is a need to monitor the health and performance of these instances, tracking the severe errors, and also, to monitor all the jobs status at one central place.
Architectural Solution
We will use ELK Stack (Elasticsearch, Logstash, and Kibana) and Filebeat, to ship logs from the Jenkins server and create a fancy dashboard to visualize them in real-time. Below is the architecture of what we want to achieve.
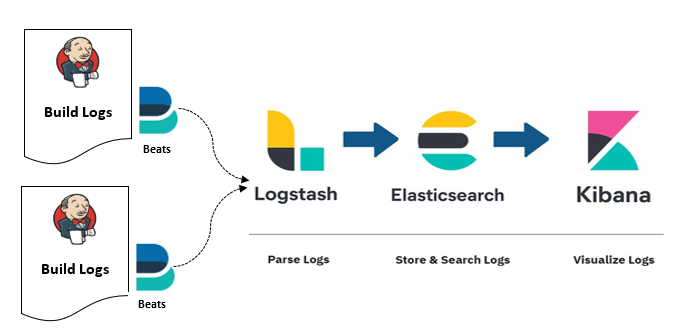
- Beats: We will use Filebeat, to ship the Jenkins Application Logs located at the path
/var/log/jenkins/jenkins.logfor Linux based machines. - Logstash: Logstash will ingest the logs sent from Filebeat and parse the logs, dynamically transform data irrespective of format and complexity, using different filter plugins.
- Elasticsearch: Elasticsearch will store the parsed logs sent from Logstash and index it in a way that supports fast searches. It provides real-time search and analytics of all types of data.
- Kibana: Kibana uses Elasticsearch as a data source to visualize data. It has a rich source of different visualization like charts, graphs, GeoIP Map, etc. It can be referred to as a search dashboard for Elasticsearch.
Let’s quickly dive into the configuration of different components to visualize Jenkins application logs. We will not cover the installation of each component, you can refer to this awesome blogpost for Installation of ELK Stack and Filebeat in Linux Machines.
Configuring Filebeat
Filebeat is a lightweight logs shipper. It is installed as an agent on your servers (i.e. Jenkins server) which will monitor the Jenkins log file, collect events, and ships to Logstash for parsing.
If you want to want to monitor all the Jenkins instances, then you need to install filebeat in all the instances and ships the application log to logstash. Here, we will ship the application logs of one Jenkins instance only.
Below is the filebeat.ymlto monitor jenkins log file.
Note: Filebeat will talk to Logstash on port 5045 (you can given port), which should be same will configuring Logstash.
################## Filebeat Configuration Example ###################======================== Filebeat inputs ==========================filebeat.inputs:
- type: log
  enabled: true
  paths:
   - /var/log/jenkins/jenkins.log
  exclude_files: ['.gz$']
  multiline.pattern: '^[a-zA-Z]+\s[0-9]{1,2},\s[0-9]{4}\s[0-9]{1,2}:[0-9]{1,2}:[0-9]{1,2}\s(?:AM|am|PM|pm)'
  multiline.negate: true
  multiline.match: after
  fields:
    type: jenkins-server
  fields_under_root: true#========================== Outputs ================================#------------------------- Logstash output -------------------------
output.logstash:
  # The Logstash hosts
  hosts: ["10.165.95.29:5045"]
  bulk_max_size: 200#======================== Processors ==============================# Configure processors to enhance or manipulate events generated by the beat.processors:
  - add_host_metadata: ~
  - add_cloud_metadata: ~
Configuring Logstash
Logstash process events in three stages: input → filter → output. In this case,
input: get logs data from filebeatfilter: used grok, date, and mutate filter plugins to filter and process logsoutput: store the processed logs in elasticsearch
input {
 beats {
        port => "5045"
    }
  }filter {
  if [type] == "jenkins-server" {# set all messages from the jenkins log as type 'jenkins' and add the @message field.
          mutate {
              add_field => ["@message_type", "jenkins"]
              add_field => ["@message", "%{message}"]
          }}
  }# now that we have possibly-multiline events, we can clean them up.
  filter {# munge the possibly-multiline messages into a single string
      mutate {
          join => ["@message", "\n"]
      }# split @message into __date and __msg, and overwrite the @timestamp value.
      grok {
          match => [ "@message", "^(?<__date>%{MONTH} %{MONTHDAY}, %{YEAR} %{TIME} (AM|PM)) (?<__msg>.+)" ]
      }
      date {
          match  => [ "__date", "MMM dd, YYYY HH:mm:ss a"]
      }# ...now some patterns to categorize specific event types...# parse build completion messages, adding the jenkins_* fields and the 'build' tag
      grok {
          match => [ "@message", "(?<jenkins_job>\S+) #(?<jenkins_build_number>\d+) (?<__msg>.+): (?<jenkins_build_status>\w+)" ]
          tag_on_failure => []
          overwrite => true
          add_tag => ['build']
      }

   # convert build number from string to integer
   mutate {
                convert => ["jenkins_build_number", "integer"]
                }# tag messages that come from the perforce SCM plugin (and associated classes)
      grok {
          match => [ "@message", "\.perforce\."]
          tag_on_failure => []
          add_tag => ['p4-plugin']
      }# if we have extracted a short message string, replace @message with it now
      if [__msg] {
          mutate {
              replace => ["@message","%{__msg}"]
          }
      }# convert @message back into an array of lines
      mutate {
          split => ["@message", "\n"]
      }
  }# clean-up temporary fields and unwanted tags.
  filter {
      mutate {
          remove_field => [
              "message",
              "__msg",
              "__date",
              "dumps1",
              "plugin_command"
          ]
          remove_tag => [
              "multiline",
              "_grokparsefailure"
          ]
      }
  }# send it on to the elasticsearch
  output {
    elasticsearch {
                hosts => ["10.165.35.19:9200"]

    # username & password to connect to elaticsearch
                user => "elastic"
                password => "elastic"

                action => "index"
                index => "jenkins-%{+YYYY.MM.dd}"}

 # use this if you want to verify logs are being sent to elasticsearch or not

        #stdout { codec => rubydebug }
  }
Configuring Elasticsearch
Elasticsearch will store and process the data in jenkins-%{+YYYY.MM.dd}the index. We will not change the default configuration of elasticsearch, which was configured during elasticsearch installation.
Configuring Kibana
Kibana is used to visualize and analyze the data stored in elasticsearch indices. We will use jenkins-%{+YYYY.MM.dd}the index to visualize the Jenkins build logs and create different fancy visualizations and combine visualizations in one dashboard. We need to create Index Pattern in Kibana first to create visualizations and dashboards.
Steps to create Index Pattern in Kibana:
- Login to Kibana (default:
http://localhost:5601) - Go to Settings → Kibana → Index Patterns
- Click on Create Index Pattern. Define an Index pattern (say jenkins-*)
- You will be able to see all the Jenkins indices will get listed. Then, click on the Next step.
- Choose the time filter (say
@timestamp). Then, click on the Create index pattern.

Now, we are ready to analyze, create a visualization, and a dashboard with captured data or events. Below we can see a sample visualization of SEVERE logs and a dashboard view of Success and Failure jobs, Frequently Running Jobs, and Jenkins All Jobs Status.


In this micro-service world, every organization is adopting E2E automation culture with tools like Jenkins. Managing, monitoring, and troubleshooting a larger number of instances every day is a lot to do.
Thus, the benefit of using ELK Stack which provides a centralized logging system is not only to provide the power of collecting and storing data in one place but also with the power to harness and analyze the logs in real-time and to find the root cause of failure while troubleshooting multiple Jenkins instance.
Connect with me on LinkedIn or say hi, mentioning this story when you write.